One owned technical source
The snapshot uses the latest Technical Audit for the workspace's exact normalized root. Account and workspace ownership stay attached to the scan, which prevents another site's result from becoming the readiness input.
AI Visibility methodology
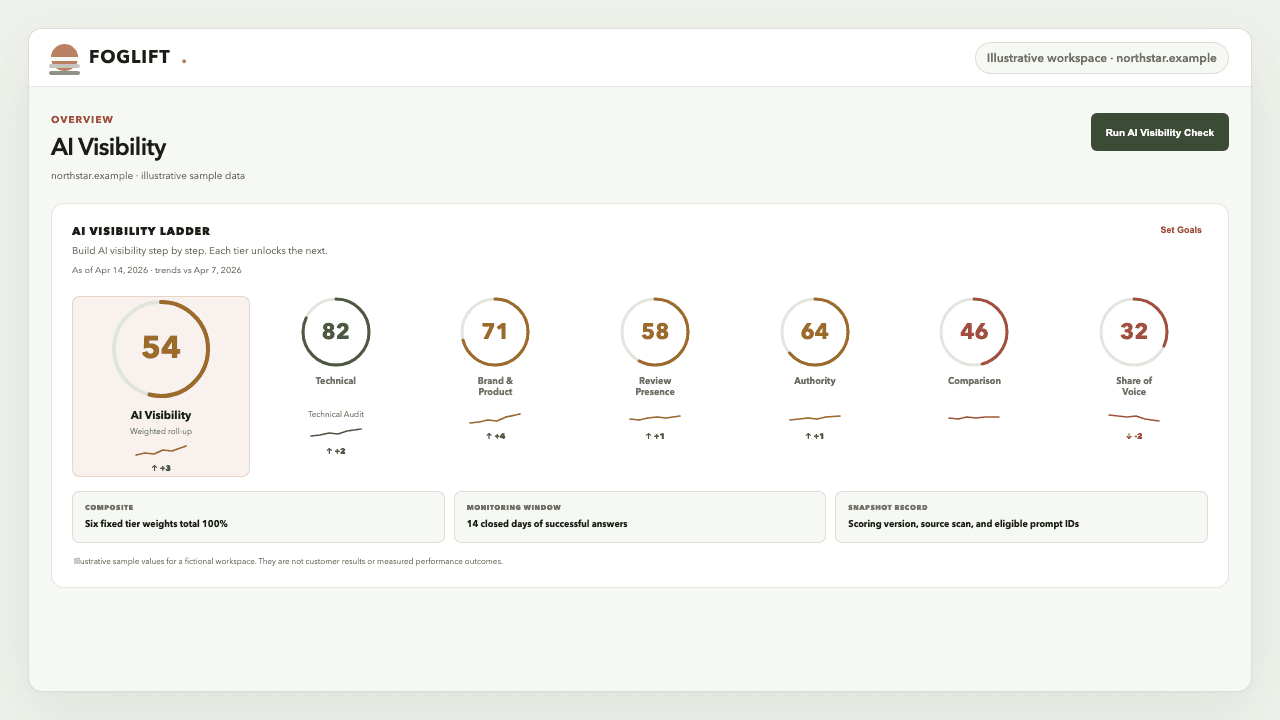
See whether access, mentions, reviews, authority, comparisons, or category share changed the result. Foglift scores AI Visibility on a 0 to 100 scale and keeps the source scans, eligible prompt counts and IDs, closed 14-day window, and scoring version behind every snapshot.
The six-tier ladder
Technical access starts the ladder at 10%. A category-level recommendation is harder to earn, so Share of Voice carries 25%. The fixed progression keeps a readiness improvement from being mistaken for an answer-level recommendation. The displayed path runs Technical, Brand Mentions, Review Presence, Authority, Comparison, then Share of Voice.
| Tier | Weight | Input | Calculation | Boundary |
|---|---|---|---|---|
| Technical | 10% | Latest workspace-owned root-domain Technical Audit | Rounded mean of the scan pipeline's two technical-readiness inputs | Scan-based. It does not use monitored prompts. |
| Brand Mentions | 15% | Active brand and product prompts | Mention rate × sentiment factor × 100 | Uses successful observations from the closed 14-day window. |
| Review Presence | 18% | Active review prompts | Mention rate × normalized review sentiment × 100 | Unfavorable framing can lower the tier below the standard presence floor. |
| Authority | 12% | Off-site brand mentions, domain authority, and sitemap freshness | 47.5% mentions + 47.5% authority + 5% freshness | Available measured signals are renormalized when a provider is unavailable. |
| Comparison | 20% | Active comparison prompts | Mention rate × sentiment factor × 100 | System-generated prompts that name the tracked brand are excluded. |
| Share of Voice | 25% | Active industry and category prompts | Mention rate × sentiment factor × 100 | Prompts that name the tracked brand are excluded from this category tier. |
Composite formula
round(Technical × 10% + Authority × 12% + Brand Mentions × 15% + Review Presence × 18% + Comparison × 20% + Share of Voice × 25%)
Every tier is clamped to 0 through 100 before persistence. An unconfigured monitoring tier is shown as two dashes in the product, while a configured tier with completed answers can show a measured zero. Both contribute zero to the current composite, so compare composite trends only after the relevant prompt categories are configured.
Snapshot provenance
Explain which site, prompts, and dates produced the number before your team changes course. Every snapshot carries its source scan references, eligible prompt counts and IDs, time window, and scoring version. Engine identity remains on the underlying answer evidence and is not frozen as a snapshot-owned set. Failed calls stay outside the denominator.
The snapshot uses the latest Technical Audit for the workspace's exact normalized root. Account and workspace ownership stay attached to the scan, which prevents another site's result from becoming the readiness input.
Brand, review, comparison, and industry tiers use successful observations collected during the 14 days ending when the score is calculated. The snapshot stores both timestamps instead of querying an open-ended live total.
The scoring job joins answers to active prompt IDs and their saved category. Industry prompts cannot name the tracked brand. System-generated review and comparison prompts that name the brand are also excluded.
Provider errors never enter the denominator. Each snapshot stores the scoring version, eligible prompt count for every monitoring tier, and the exact eligible prompt IDs used for the calculation.
Monitoring-tier math
Brand Mentions, Comparison, and Share of Voice start with the share of eligible answers that mention the brand. Their sentiment factor is 0.5 + 0.5 × max(0, average sentiment), which creates a 0.5 floor for a mention without favorable sentiment and a 1.0 ceiling.
Review Presence uses a different formula: mention rate × ((average sentiment + 1) / 2) × 100. That wider normalization lets unfavorable review framing reduce the score below the standard presence floor.
| Answer label | Tier value | Effect |
|---|---|---|
| Positive | +0.8 | Raises the sentiment factor toward its 1.0 ceiling |
| Neutral | +0.5 | Adds presence credit without treating the answer as an endorsement |
| Mixed | +0.3 | Keeps partial credit for a qualified or balanced mention |
| Negative | -0.8 | Clamps to zero inside the standard presence sentiment bonus |
Two share-of-voice views
The Share of Voice tier asks whether the brand earns category-level inclusion across eligible industry answers. The separate competitive percentage asks how the mentions inside a declared market are divided.Foglift keeps both denominators visible.
| Measure | Numerator | Denominator | Use |
|---|---|---|---|
| Share of Voice tier | Eligible industry-prompt answers that mention your brand, adjusted by sentiment | All successful eligible industry-prompt answers in the 14-day tier window | A weighted rung in the six-tier composite |
| Competitor share-of-voice percentage | Your brand mention count | Your brand mentions plus all tracked competitor mentions in the declared comparison set | A competitive mention-share metric outside the composite formula |
Competitive share of voice = your brand mentions / all tracked brand mentions × 100
Zero-mention answers remain in the answer evidence but do not add a brand to this mention-share denominator. Hold the prompt set, competitors, engines, and date window stable when comparing periods.
Read the full share-of-voice measurement guideCurrent plan boundary
Every plan uses the same six-tier scoring contract. Paid plans add engine breadth, faster allowed monitoring cadence, larger brand allowances, and developer access. A slower selected cadence remains valid.
| Plan | Price | Evidence access | Fastest cadence |
|---|---|---|---|
| Free | $0 | Unlimited Technical Audits and one brand with active-use weekly Perplexity monitoring | Weekly while active |
| Launch | $49/mo | Three brands, all five engines, API, CLI, MCP, and full-site Technical Audits | Up to daily |
| Growth | $129/mo | Ten brands, all five engines, Buyer-intent Win Rate, and larger workspace allowances | Up to twice daily |
| Enterprise | Custom | Custom brand and workspace allowances across all five engines | Up to hourly |
Provider boundaries
The score uses brand presence and sentiment in the answer. Provider-returned citation URLs stay attached as a different field because an engine can mention a brand without citing its domain, and citation availability varies by engine.
Documents web-search responses with sourced citations, which Foglift stores separately from a brand mention.
Documents cited web-search answers and the source metadata available with supported Claude responses.
Explains that AI Overviews and AI Mode can use different models, techniques, and supporting link sets.
FAQ
Foglift multiplies six 0 to 100 tier scores by fixed weights, then rounds the sum: Technical Readiness 10%, Authority Readiness 12%, Brand Mentions 15%, Review Presence 18%, Comparison 20%, and Share of Voice 25%. The weights total 100%, so the composite also stays on a 0 to 100 scale.
The four monitoring tiers use successful answer observations from a closed 14-day window. Each snapshot records the start and end timestamps, scoring version, eligible prompt counts, and exact prompt IDs. Technical and Authority Readiness use the latest workspace-owned root-domain Technical Audit available when the snapshot is calculated.
Foglift first calculates the brand mention rate for the eligible prompt category. It then multiplies that rate by a sentiment factor between 0.5 and 1.0. Brand and product prompts feed Brand Mentions, comparison prompts feed Comparison, and industry prompts that do not name the tracked brand feed the Share of Voice tier.
Review Presence uses review-category prompts and combines their mention rate with sentiment normalized from -1 to +1 onto a 0 to 1 scale. This lets unfavorable review framing lower the tier instead of receiving the same floor used by the Brand Mentions, Comparison, and Share of Voice tiers.
No. The Share of Voice tier scores brand presence and sentiment across eligible industry prompts. The competitor share-of-voice metric divides your brand mentions by all tracked brand mentions in the same prompt, engine, competitor, and date window. Foglift shows both because the tier measures category visibility while the percentage measures competitive mention share.
Foglift shows an unconfigured tier as two dashes and offers an add-prompts action. A configured tier with completed answers and no qualifying brand presence shows a measured zero. The current composite uses zero as the numeric input in either case, so teams should configure every relevant prompt category before comparing composite trends.
No. Foglift excludes errored observations from tier scoring. It also keeps only rows attached to active, eligible workspace prompts and excludes self-naming industry prompts plus system-generated review or comparison prompts that name the tracked brand.
Every plan includes the six-tier scoring framework and unlimited Technical Audits. Free includes active-use weekly Perplexity monitoring for one brand. Launch starts at $49 per month with all five engines and up to daily monitoring, Growth starts at $129 per month with up to twice-daily monitoring, and Enterprise uses custom pricing with up to hourly monitoring.
Use the same evidence loop
Start with weekly Perplexity monitoring on Free. Move to all five engines, faster cadence, and developer access from Launch at $49 per month.